MONITOR YOUR PIVOTS
View the record of the risks that have been carried out in the season automatically with our solution for circular irrigation pivots. For other irrigation systems you can keep a detailed and organized control of the irrigation applied to the crops. If desired, complement the irrigation log with sensors to read soil parameters and visualize the effectiveness of irrigation.
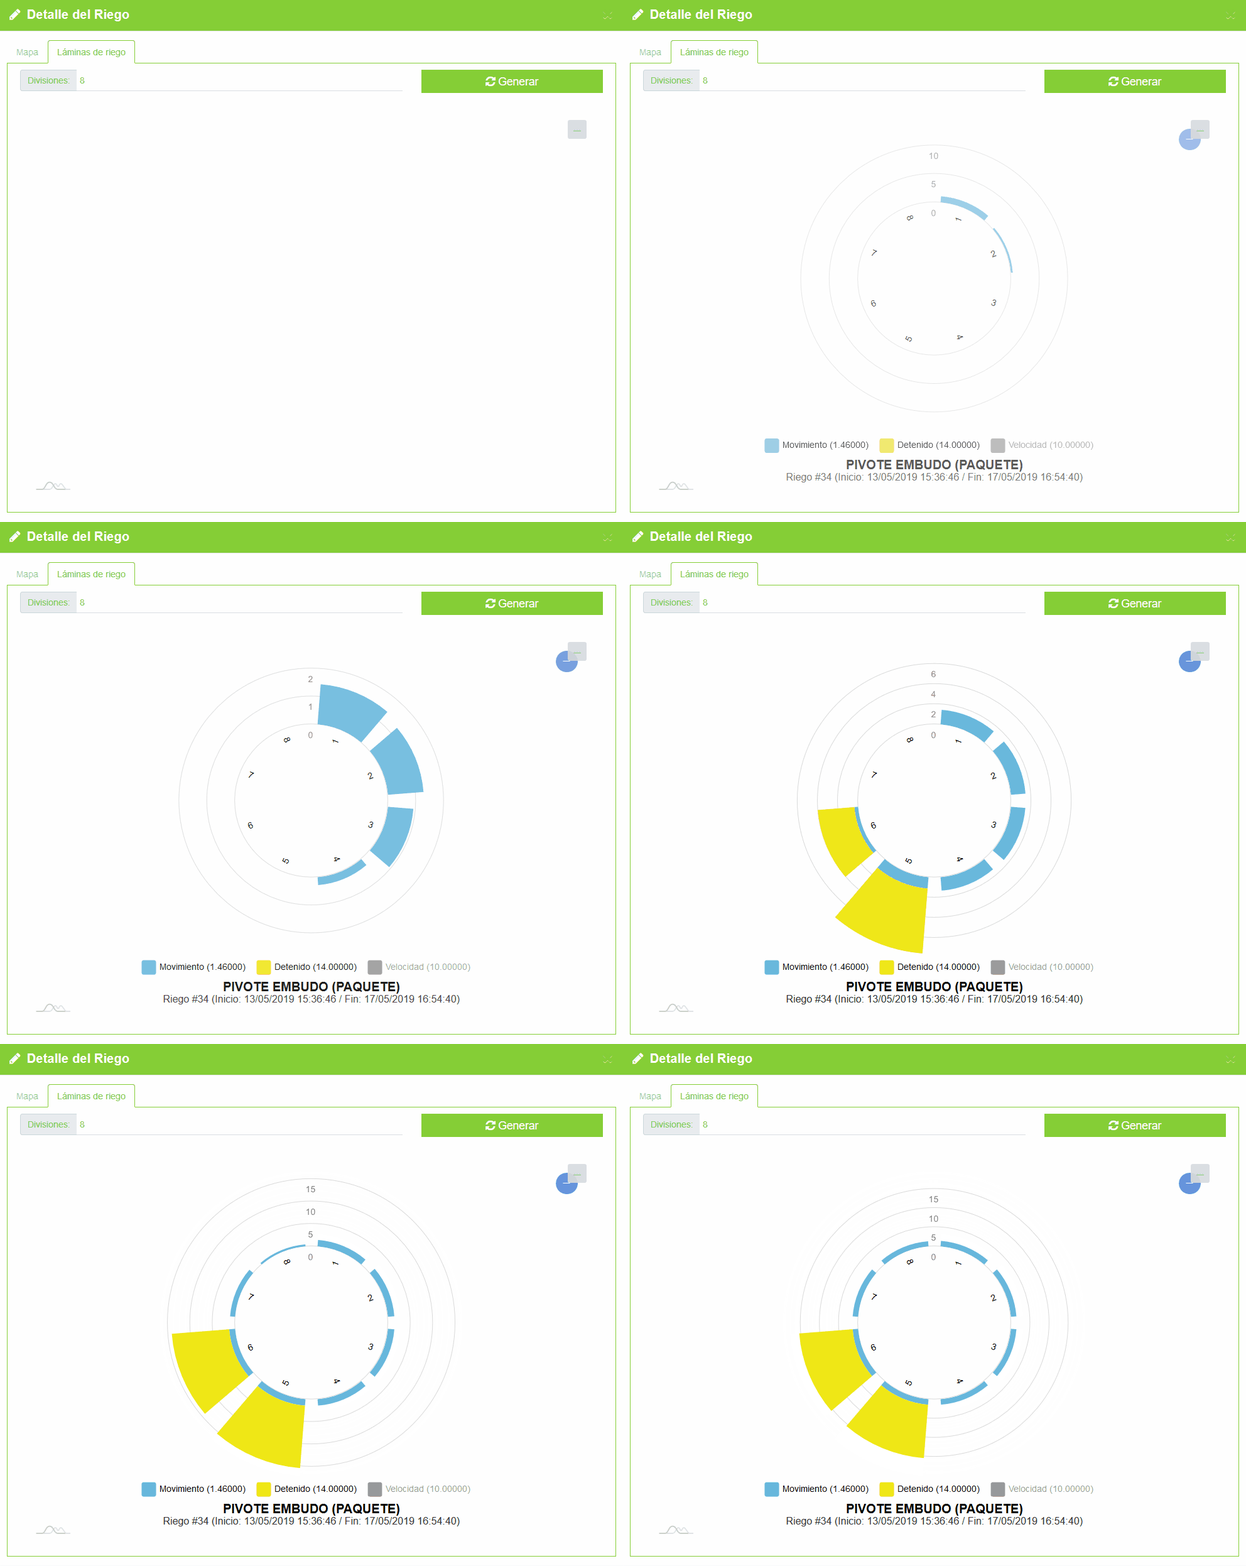
GRAPHIC DISPLAY OF IRRIGATION
Analyze with the interactive graph the behavior of your irrigation pivot:
- Know the speed and layers applied to each irrigation.
- Identify the areas where there was excess irrigation.
- Displays the accumulation of layers applied in a specific period.
- Check the irrigation layers per hectare.


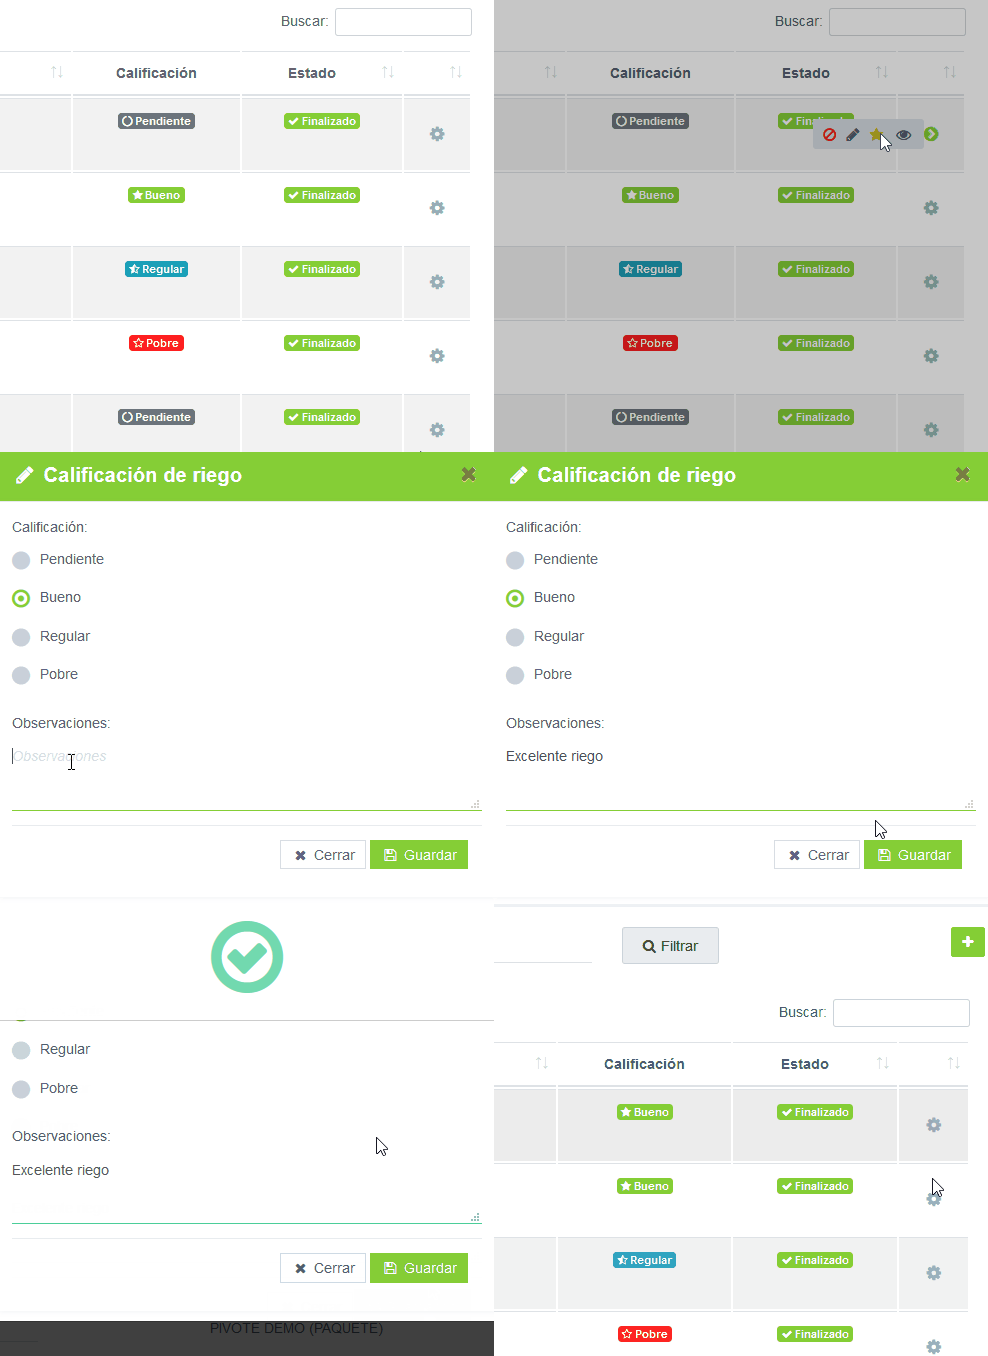
QUALIFY YOUR IRRIGATIONS
Evaluate your risks: either good, regular or poor and take actions for the benefit of your crop.

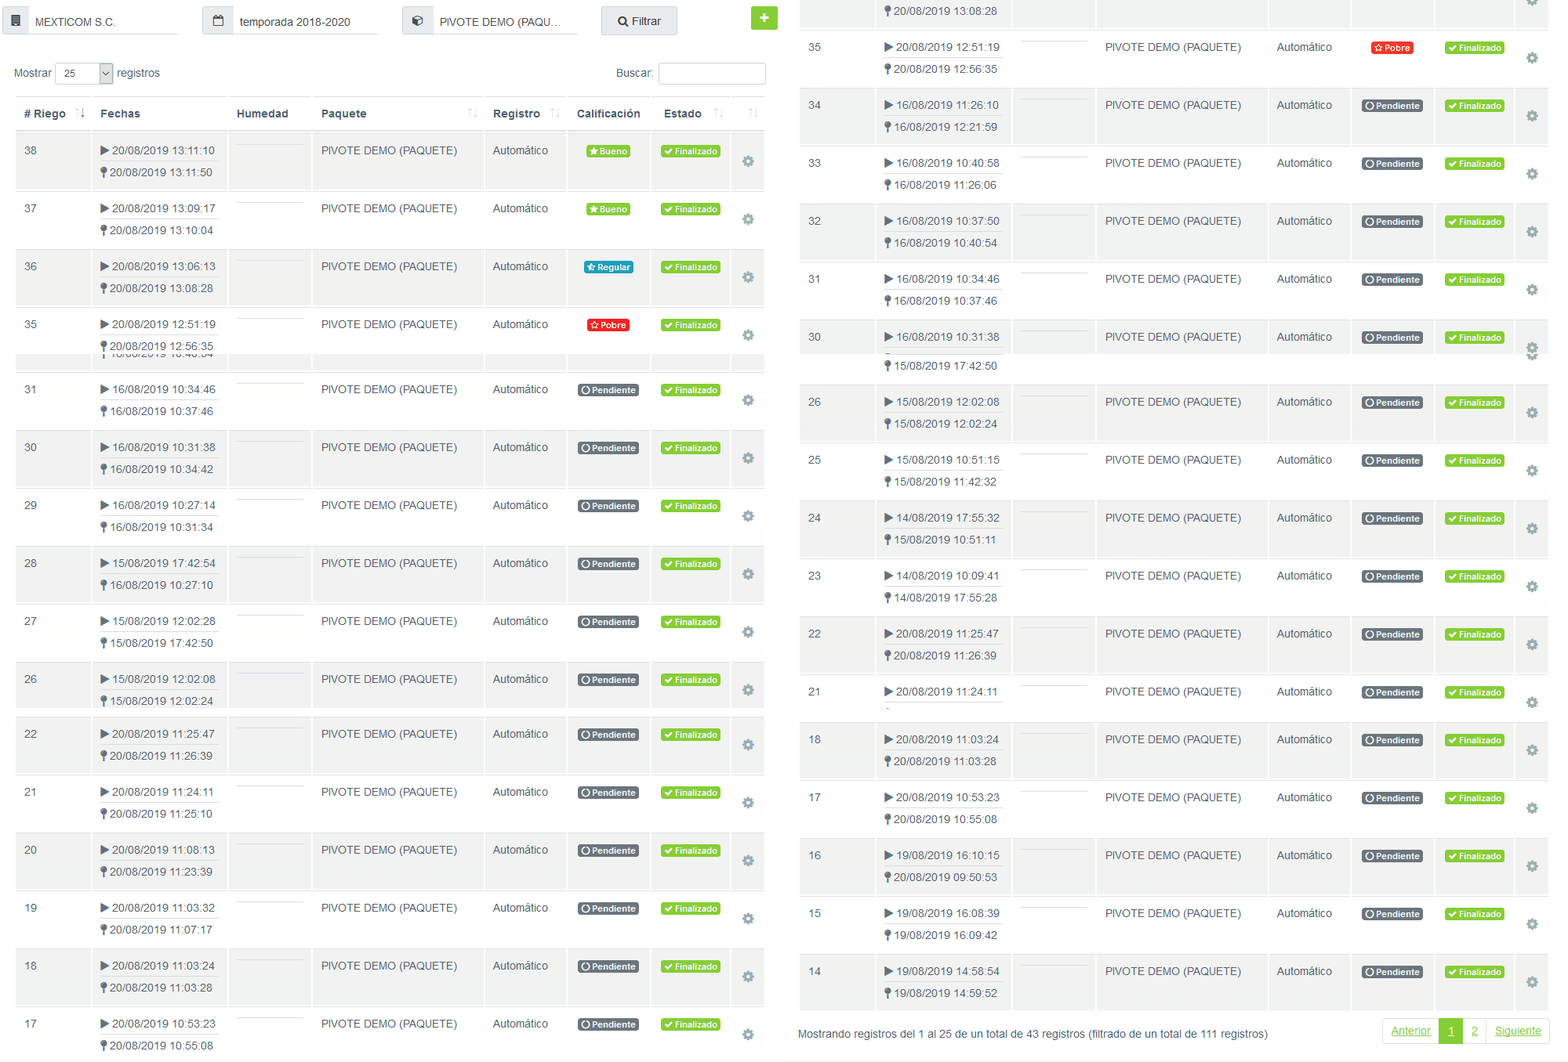
HISTORY OF IRRIGATIONS PER SEASON
Check the history of the irrigation applied in your land and the conditions in which each one was generated (humidity, temperature, phenological stage, etc.).